-
Bayesian Analysis
As usual, great thread.
A proper fact-based rebuttal and none of the wishful thinking stacked on deception of @MichaelWorobey or @beyerstein.And on the very likely start of the outbreak from mid-Oct to mid-Nov 19 (something accepted by most of the scientific community):
Also just published:
"Liang Wannian takes aim at suggestions of strong evidence linking the market with early community transmission"
scmp.com/news/china/sci…I have been reminding everyone that both Chinese scientists (since Feb 20) and Oxford-educated Gao Fu have largely dismissed the market theory (in May 20 and again in July 21 for Gao):
In doing so Liang Wannian actually confirmed a conclusion of DRASTIC - something that @MichaelWorobey got wrong:
The dental report of the 8th is not for Mr Chen but likely for his child.
Why would Mr Chen still have baby teeth?
Did Michael check it with specialists, as we did?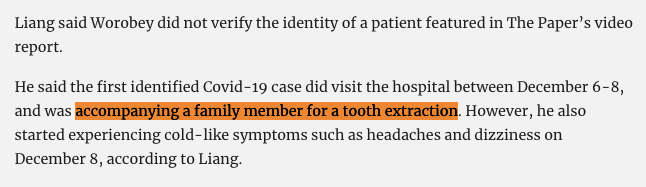
As for the cold-like symptoms, DRASTIC is still divided. The language used in the various interviews and medical report is not very clear.
Somewhere between the 8th and the 16th for sure.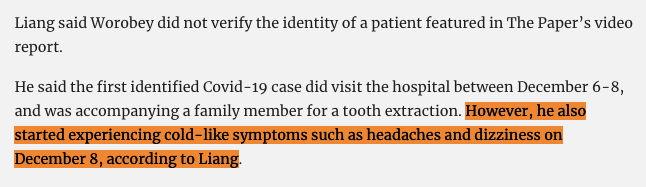
Anyway Mr Chen did not travel out of Wuhan (except to go to a scenic spot north of the city).
Nor did he shop in any wet market (RT Mart was a modern foreign-owned supermarket chain).
So the outbreak had clearly reached the other side of the city by the 16th Dec at the latest.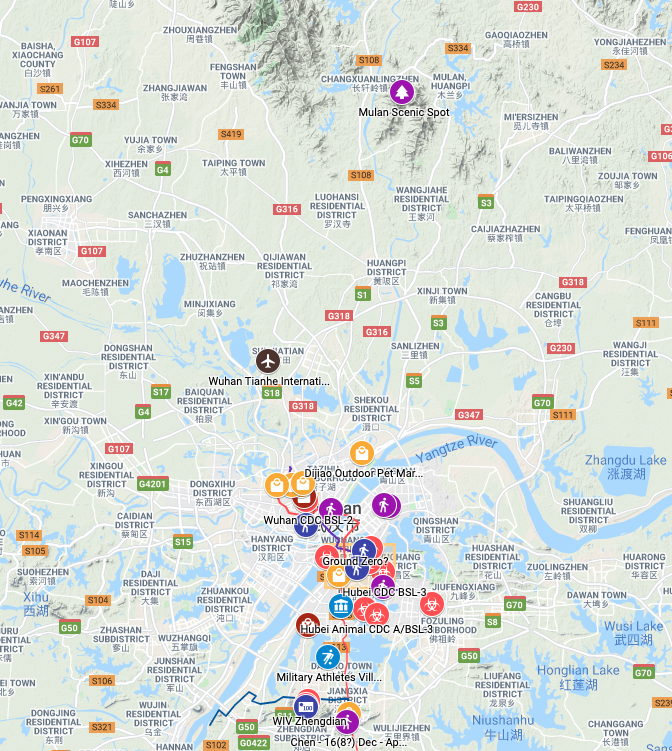
Which again makes a mockery of the theory that the first cases started in the market in the second week of December and then spread from there.
No, the outbreak most likely eventually reached the market a few weeks after starting in the city.
In particular one should check the Wuhan Uni ABSL-3.
There is a possible ground zero around there.
Wuhan Uni ABSL-3 worked with primates and humanized mice with the WIV on EcoHealth funded projects.
Last ,those who keep saying that SARS-CoV-2 lab infections don't occur can go on a hike, as the Taiwan P3 (Dec 21) and the Beijing P3 (Jan or Feb 20) show.
-
November Cases
Going back to the existence of Nov cases that have since then been 'cancelled' by China, please remember the US intel Nov 19 warning.
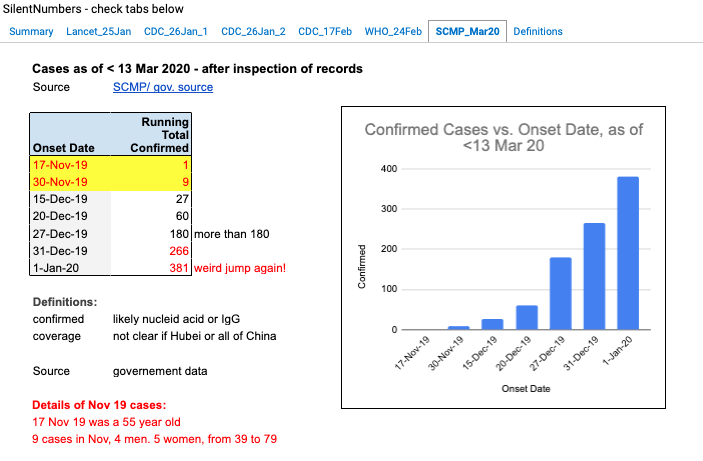
researchgate.net/publication/35…Also remember the nine Nov confirmed cases from the SCMP (based on official Chinese sources).
My Silent Numbers give you all the sources (inc. the SCMP without firewall).
I also graphed the SCMP numbers (SCMP tab at top)
bit.ly/2OyytJ4
@jbloom_lab @MichaelWorobey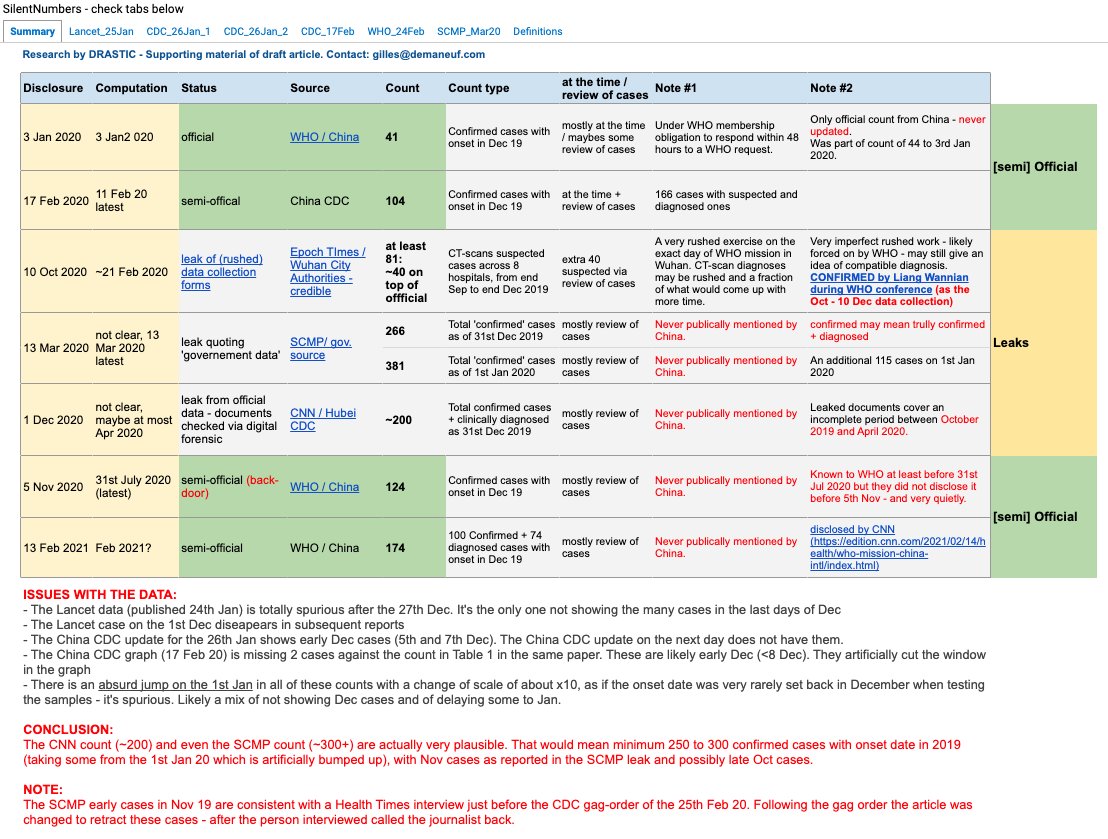
One of the best papers I read about dating the index case is actually co-authored by Worobey himself.
That's Pekar et al with its mid-Oct to mid-Nov estimate - which we referred to extensively in our 'October Surprise'.
Pekar et al: science.org/doi/10.1126/sc…In the 'October Surprise' you can also read my analysis of the game played by China - walking the epidemiological trail AWAY from the earliest known cases.
researchgate.net/publication/35…
Also, do you really think that China would have suppressed the Nov cases and the early Dec ones if they pointed to the market?
Please take a second to think about it.
So one can believe in fairies and a December 'patient zero'.
Or one can look at the epidemiological and genomic evidence, plus the data leaks and various ham-fisted 'cancels', which point us to cases in Wuhan in Nov 19.
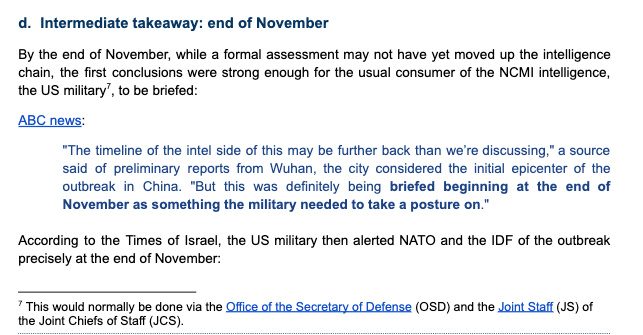
Nov 19 cases that could be detected from space and via com intercept, as the NCMI did.
And it showed a reliable enough picture for the US to alert Nato and Israel at the end of that very month.
researchgate.net/publication/35…
@thedeadhandbook @ianbirrell @thackerpd @KatherineEban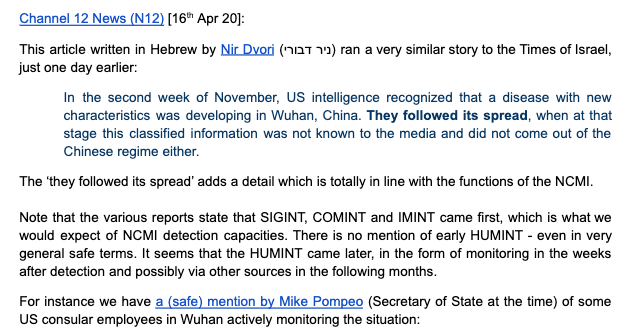
In the end we have two likely 'ground zeros'.
One in particular is centered on the WIV, the Wuhan Uni ABSL-3 (worked with the WIV) and the PLA hospital of central military command (which shows up in relation to early cases, inc. Nov ones from US intel)
I'll leave the fairies to the MSM, and the December data illusion to the 'Perspectives' section of Science mag.
-
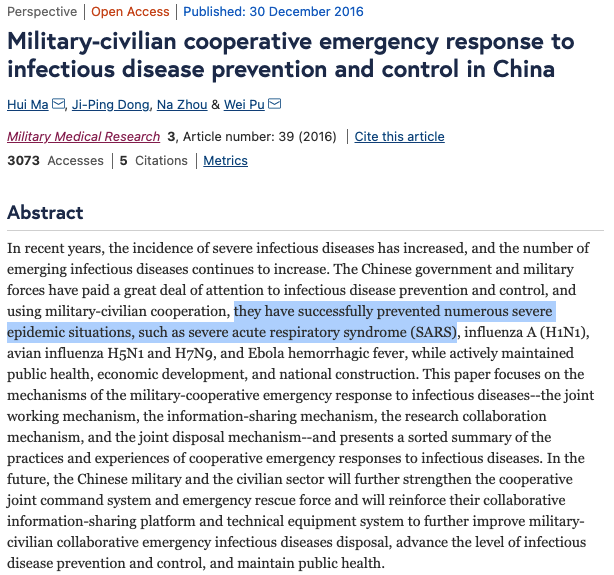
Military-civilian cooperative emergency response to infectious disease prevention and control in China
Here is an interesting article worth discussing.
This was published in 2016 in the journal of Military Medical Research, a Springer Nature journal which is edited by the PLA.
[Nature and its pangolins papers, the PLA... Yes, I know!]
mmrjournal.biomedcentral.com/articles/10.1186/s40779-016-0109-yThe paper is about the positive role the PLA is playing in infectious disease prevention and control.
The 2nd sentence of the paper gives you the theme, praising the contribution of the PLA to the prevention of SARS.
Maybe they have in mind keeping secret military files that made it impossible for the WHO to control and monitor the spread of SARS in Beijing in 2004.

Or maybe they have in mind the fact that patients were hidden in PLA hospitals, who them moved them out temporarily when the WHO was eventually allowed to visit these hospitals.
Transparency in the local fashion.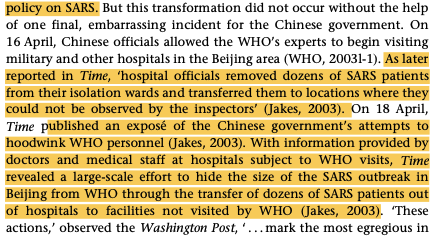
But anyway, clearly the Editor (the PLA) had no problem peer-reviewing this paper written by 4 PLA members, and published in the prestigious and highly professional Nature.
So we are good with that and let's move on to some interesting insights.
One of the reasons for the PLA involvement in outbreaks control is to 'maintain social stability'.
It's also a rehash of Xi Jinping's move for a tighter civil-military integration in all parts of society.
Nice to see that they did not forget to mention him.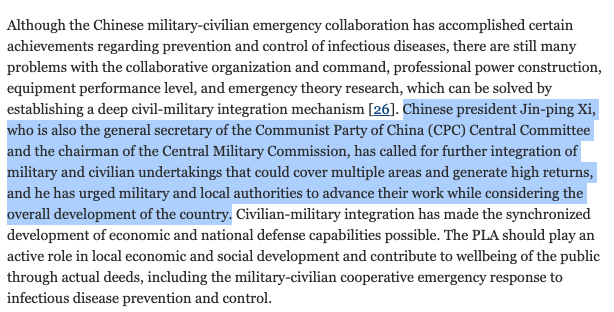
Some recommendation:
'the military immediately initiates the emergency research mechanism, [--] and deploys emergency research tasks to scientific research institutions'
We saw that with Major Chen Wei
www.scmp.com/news/china/military/article/3064677/meet-major-general-chinas-coronavirus-scientific-front-lineAnother recommendation: Informatization of military-civilian collaborative management means
We saw that with the 'public' early-cases database (managed by Pr Chuanhua) effectively being a front that was 'sanitised' while the military had its own private database of early cases.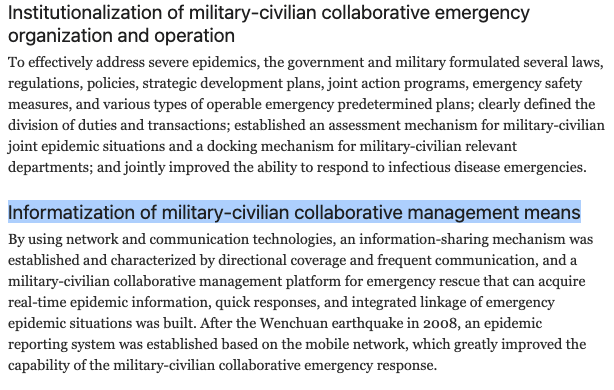
The real database was managed by the National University of Defense Science and Technology, and informed some key modelling based on the actual movements of early cases.
Powerful modelling was available to the Chinese government based on the real data.
gillesdemaneuf.medium.com/early-cases-of-suspected-covid-19-in-wuhan-feb-20-data-collectionLast, the military must play a key role in identifying the index case and in the early 'disposal of local epidemic outbreaks'.
'Successful past experiences that resulted in preferable public effects can be attributed to the army'.
I wonder what preferable public effects means.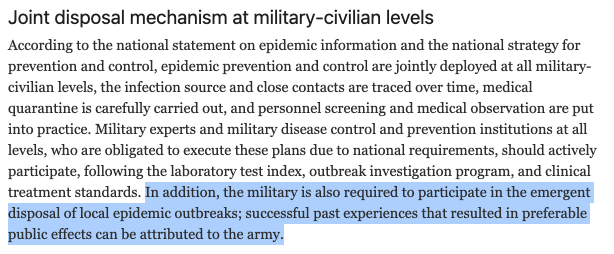
-
White Unicorns - or the silly stories about no Covid-19 positive tests at the WIV (and other labs)
Issue #1:
Sorry @China__Focus, but you have been caught lying.
From the official website of the Institute of Virology in August 2020, the Institute normally hosts 325 graduate students and 268 employees. That gives us a total of around 593 people.
Ignoring your 2019 typo (should be 2020), the 700 tests ILI samples are from the Wuhan Xiehe Hospital - not from the WIV (which anyway has 590 staff and students).
From Annex D7 of the China-WHO study report:
Issue #2:
The WIV did test some lab staff in April 2019 and March 2020.
Given that the prevalent IgG+ rate in Wuhan was about 4.4% at the time then there would have been positive tests.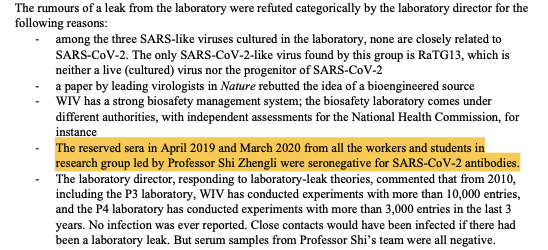
First let's be clear that the prevalent IgG+ rate was around 4.4% in urban Wuhan around April 2020 (95% confidence interval: 4.0%-4.8%).
See jamanetwork.com/journals/jaman…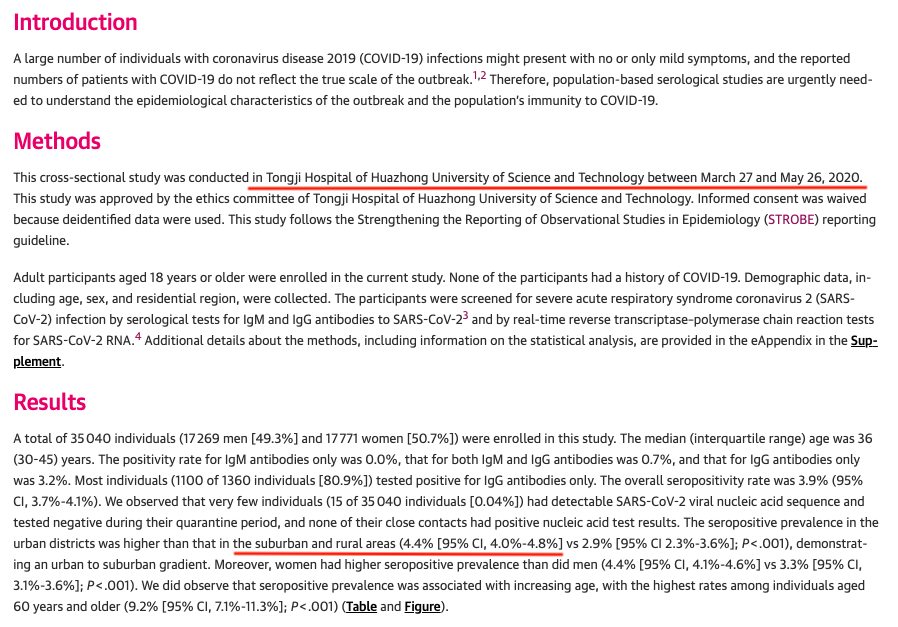
Then let me show you the probability of 0 IgG+ (positive test for pas Covid-19 infection) amongst 550 staff and students at the WIV (I cut it a bit from 590):

Let's try again with the lower value of the confident interval: 4%, and let's say that the WIV was a bit lazy and tested only 100 students and staff (which makes the test quite irrelevant actually):
1.7% is one chance in 60.
Said otherwise people at the WIV MUST have tested positive for Covid-19 antibodies (IgG) in March 2020.
Either a ridiculously small group of people was tested (17 people gives 50/50 chance of 0 positive with a 4% background rate) or the whole story is just lies.
To make it worse, the WIV should have actually tested all 590 staff and students, plus construction workers.
That was not the first time funny statements were made about no positive antibodies test at labs in Wuhan. Let's go through previous examples:
Shi Zhengli’s Reply to Science Magazine, pdf dated 27th 2020:Q: Is it possible that someone associated with the institute became infected in some other way, for instance while collecting, sampling, or handling bats?
A: Such a possibility did not exist. Recently we tested the sera from all staff and students in the lab and nobody is infected by either bat SARSr-CoV or SARS-CoV-2. To date, there is "zero infection" of all staff and students in our institute.
Peter Embarek quoted in Science Magazine 14 Feb 21:Q: But my question is whether you learned anything new in China. Now that you’ve been there, do you have more reason to say it’s “extremely unlikely” than before?
A: Yes. We had long meetings with the staff of the Wuhan Institute of Virology and three other laboratories in Wuhan. They talked about these claims openly. We discussed: [--] ‘Did you test your staff? [--]. They had retrospectively tested serum from their staff. They tested samples from early 2019 and from 2020.’
And then these so statements of no positive cases were used in the China-WHO report to dismiss any possiblility opf a lab-related accident:
Arguments against
[---]The three laboratories in Wuhan working with either CoVs diagnostics and/or CoVs isolation and vaccine development all had high quality biosafety level (BSL3 or 4) facilities that were well-managed, with a staff health monitoring programme with no reporting of COVID-19 compatible respiratory illness during the weeks/months prior to December 2019, and no serological evidence of infection in workers through SARS-CoV-2-specific serology-screening.
Maybe you would ask if one could argue that the WIV people were somehow isolated from the general population in the "safety" of their lab?
Unfortunately no. A few lab researchers may have isolated untill Wuhan got into a lockdown on the 23rd Jan. But that would be a small fraction of the population of interest, which is all staff including maintenance plus students.
The ones who may have self isolated at the WIV and other labs of interest would have been the ones studying SARS-CoV-2 and doing corresponding sample testing.
But that would be a small fraction of the population of interest, which is all staff including maintenance plus students. Most of these most likely never self isolated before the Wuhan lockdown and are representative of that Wuhan urban population with a demonstrated 4.4% seropositivity in April 20 (95% Confidence Interval: 4.0%-4.8%).
Mathematical corner:
Here is how you can easily tabulate the probabilities in your head:
The key is to remember that with a 4% seropositivity rate there is very close to a 50% chance of no seropositive in a group of 17 people.
This is a simple binomial distribution result. See for instance this online calculator.
If you add another 17 people, the probability of no seropositive in the group is again divided by 2. From there you can see that the probability of no seropositive at in a group of (n * 17) people is ~1/2^n.
510 is still short of the 590 staff and students at the WIV.
510 = 30 x 17 = 3 x 10 x 17. But 1/2^10 ~ 1/1,000, so the probability of no seropositive in a group of 510 people is around 1/1,000^3 = 1 in a billion!
If you prefer to work in powers of 1/100 then the probability is about 0.01 for a group of 113 people. So for 565 people (5 x 113) it becomes 1/10^10, a 10th of a billionth!Issue #3:
Now going back to that paper jamanetwork.com/journals/jaman…, it’s interesting to see that ‘Informed consent was waived because de-identified data were used.’
Basically no need to ask people for consent as data is anonymised.
But for some reason the joint-team mission could not have access to raw data due to the very strict privacy laws in China.
Not sure how that works - since you can apply for a waver with anonymised data, as was done for that paper.
I call that a lie.
prospectsconsultation.co.uk/who-coronaviru…
Maybe that explains why @DrTedros lost patience with all the nonsense and foot dragging from the Chinese authorities.
#DRASTIC -
Learning from the past - or not.
Anybody who really wants to understand China's attitude today would benefit from reading Chapter 5 of this excellent book:
bit.ly/3fzHFbr
According to this table from the WHO update of the 16h March SARS had nothing to do with China. No case officially reported - just some unrelated atypical pneumonia.
SARS clearly must have started in Hong Kong or Vietnam.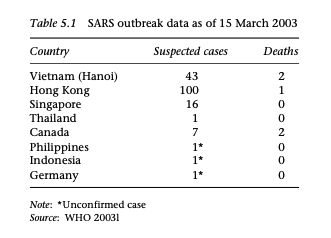
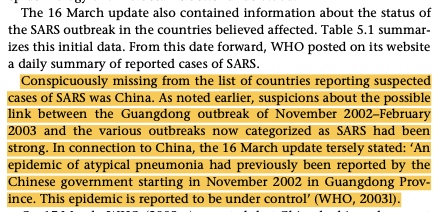
Anyway according to Chinese scientists these atypical pneumonia cases in China were Chlamydia pneumonia, which can be treated with antibiotics - no worry it's all under control.
Keep moving and check Hong Kong instead.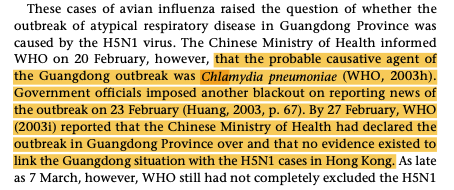
That did not go too well with the WHO when they eventually met Chinese health officials in Beijing on the 24th March 2003.
And as usual there was no data to show. Also trust us it's Chlamydia.
No need to go ad visit Guangdong as well.
And it went on like this. April was not any better.
China kept saying that it had nothing to hide and was not covering up. Just trust us.
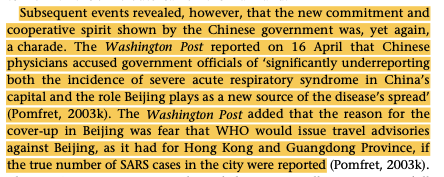
But soon the story started changing:
But then the problem moved to Beijing, where once, again - trust us - there was nothing particular going on.
It there are any cases in Beijing there are imported from Thailand.
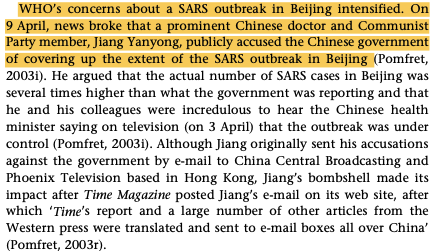
However soon Dr Jiang Yanyong of the 301 PLA hospital in Beijing had enough of that charade and raised the alarm:
But China kept dragging its feet, especially blocking access to the military hospitals where many SARS patients were being treated.
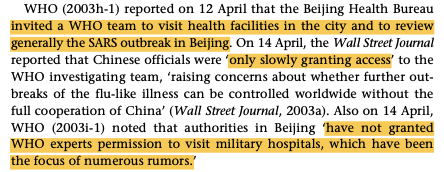
Despite promises, China kept underreporting cases, using the PLA and its military hospitals to hide the cases.
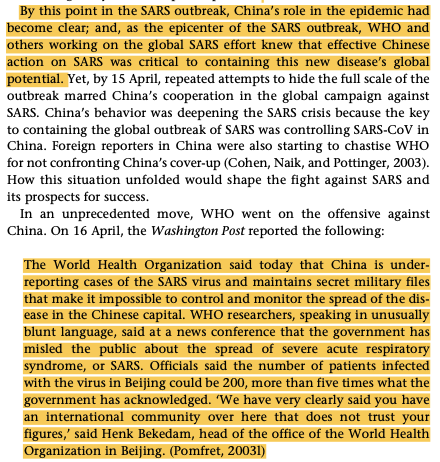
Eventually the WHO had enough and rebuked Beijing:
But to the very end Beijing tried to cheat its way through.
After agreeing to the WHO team visiting some key hospitals, Beijing started moving the patients out to other facilities or even moving them around in ambulances for the duration of the WHO visits.
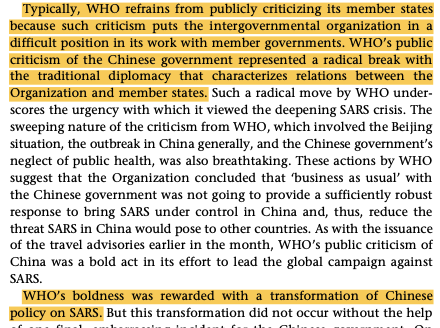
Things only started improving at the end of April.
In all 5 months were wasted due to Beijing's obfuscation - all the way paved with reassurances of its honesty and transparence.
washingtonpost.com/archive/politi… -
Nothing changes - China just got better at pretending and playing the WHO
This is the crux of the matter.
Add to that the team leader, Peter Embarek, is a foodborne diseases expert. Maybe that explains why China chose him instead of the 3 US candidates.
No surprise then that the report goes for food-induced zoonoses, despite any evidence for it.When you have a hammer as only tool (and there was not one lab-forensic expert in the team) - then everything is a nail.
We needed people like Tony Della Porta.
linkedin.com/in/tony-della-…
But wait, China did not want him to do the investigation of the SARS Beijing leaks in 2004.The problem is that Tony did a great job investigating the Singapore SARS leak and then the Taiwan SARS one in 2003.
Way too good a job for Beijing. So he was not picked up.
And predictably the WHO 'investigation' of the Beijing leak was a whitewash.
👉🏻No report ever published!
At the end of the day, it's the same story of hiding the truth, hiding the numbers, not cooperating and dancing around the WHO.
SARS 2002/03, Beijing SARS leak 2004, Covid-19 it's all the same pattern of non-cooperation and deception.
gillesdemaneuf.medium.com/the-good-the-b…The only real change is that China is only getting better at it.
It is NOT more transparent. It is NOT cooperating more (in any real sense). It is just smarter at pretending.
But it is essentially the same story.
@threadreaderapp compile
-
A long history of addressing epidemics with lies
@MFA_China Why don't you start by scientifically explaining the obvious manipulations of the 2019 cases by China?
Here is a good start from your very own CDC (27th Jan 20):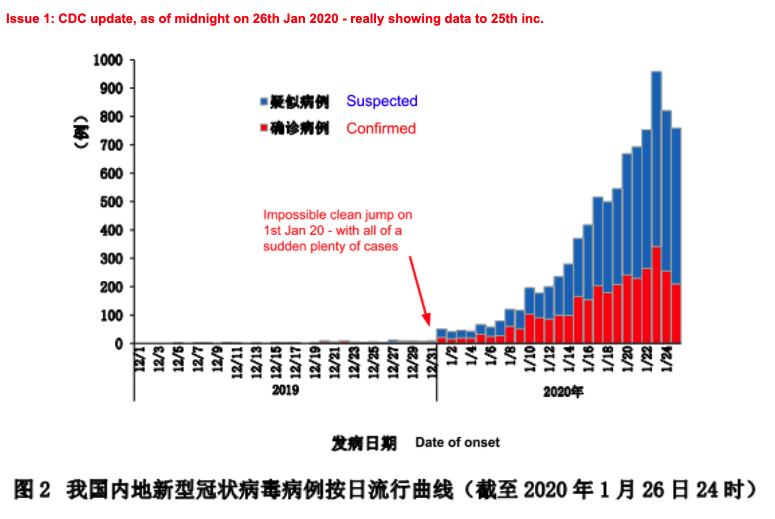
@MFA_China I have a full catalogue of your 'disappearing' confirmed cases.
pihabeach.micro.blog/2021/03/22/am-…
I am not sure what your definition of science is, but mine does not allow for crude lies and manipulations.
@MFA_China With a good example of the CDC gag order of the 25th Feb 2020 at play:
@MFA_China But there is plenty more. Just read our 'Silent Numbers', or the systematic distortion and misreporting of 2019 cases.
docs.google.com/spreadsheets/d…
@MFA_China And since China is so transparent, could it actually release the WHO investigation report of the very bad SARS leaks at the top Chinese P3 (Beijing) in 2003?
Funny enough, it was never made public! That's transparency with Chinese characteristics.
gillesdemaneuf.medium.com/the-good-the-b…@MFA_China Is it because it exposes crass incompetence and incredible bad practices, such as a SARS sample fridge moved into the corridor outside of the lab, without forgetting an attempted cover-up?
news.sina.com.cn/c/2004-07-12/1…
@MFA_China Or maybe you could tell us how China was moving about a 100 patients out of hospitals to hotel rooms or just driving them in ambulances when the WHO was investigating the SARS outbreak in Beijing in 2003?
smh.com.au/national/sars-…@MFA_China Or again: washingtonpost.com/archive/politi…
@MFA_China And don't forget to tell us how China tried to blame Hong Kong and even Thailand for the SARS outbreak in Beijing.
Bad habits die hard...
tandfonline.com/doi/pdf/10.101…
@MFA_China Blame anybody (Italy, France, Spain, US, etc) but China - that's the usual answer of the Chinese government to epidemics.
Unfortunately everybody can see through your BS. Sorry, I know, it's so unfair. China is clearly a victim of the West.
link.springer.com/content/pdf/10…
@MFA_China @threadreaderapp compile
-
Shaping - Oddities in the confirmed cases graphs of the Feb 20 WHO report.
Am I the only one having problems making sense of the confirmed cases graphs in the WHO report of the 24th Feb 2020?
Page 7 is very troubling.
First there is an error of 2 days in the reporting dates of the 3 graphs (7/14/22 of Feb instead of 5/12/20).
drive.google.com/file/d/1cLW3dE…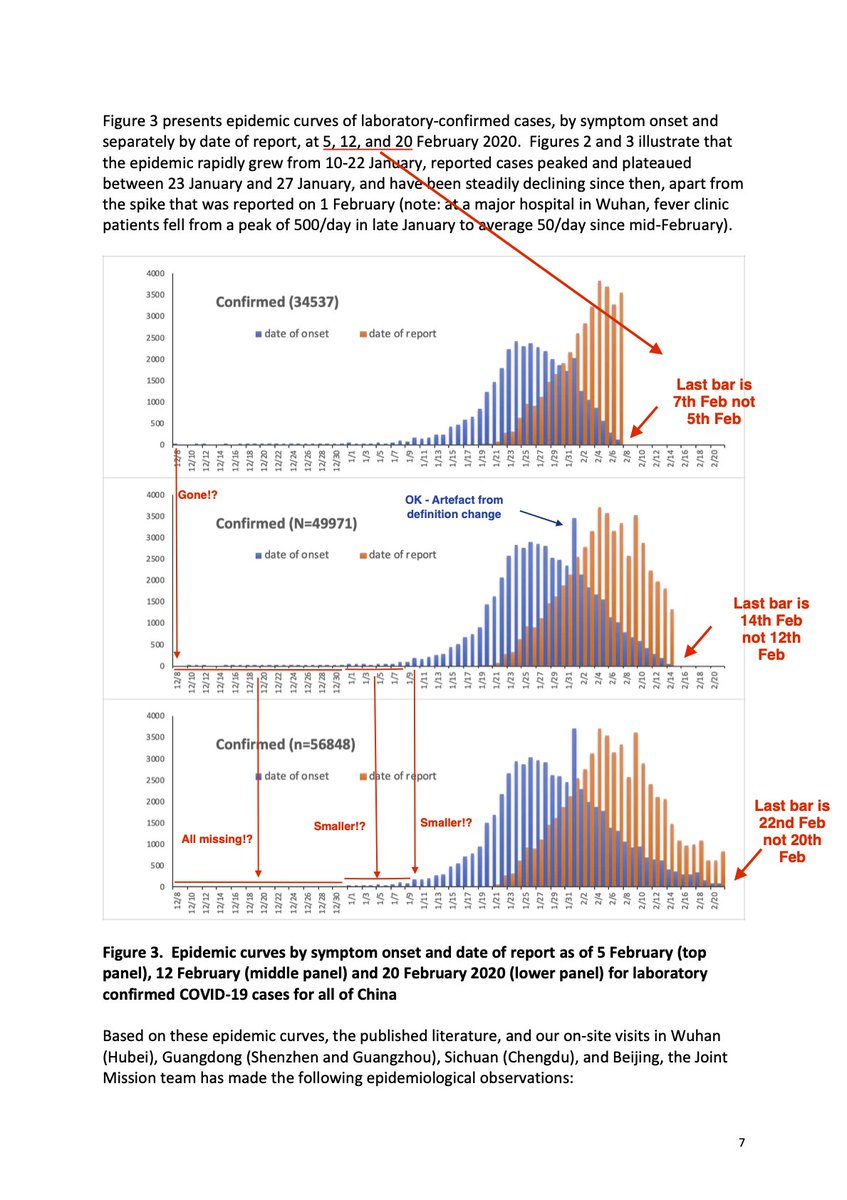
Then the first case (8th Dec) in the 1st graph (reporting as of the 5/7? Feb) is missing in the 2nd Graph [12/14? Feb].
And all the Dec 19 cases are missing in the 3rd graph [20/22? Feb], and there is some shaving of the number of early Jan cases!
@MarionKoopmans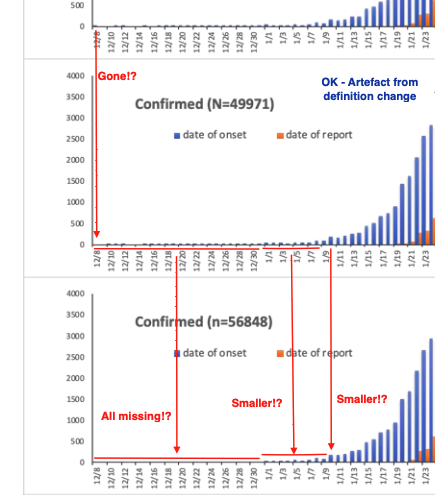
Now as these are all laboratory confirmed cases it's really odd. Once it has been reported a case should still be reported in the next graph (next reporting date).
Unless they play around with the onset dates and move the cases around, or simply 'disappear' them.But what particularly strikes me is that the early Jan 2020 cases seem to be actively reshaped in the last graph to make it look more a late breakout, especially by shaving the first few days of Jan and even the 10th Jan:
I guess that the original graph such as given here does not look too good.
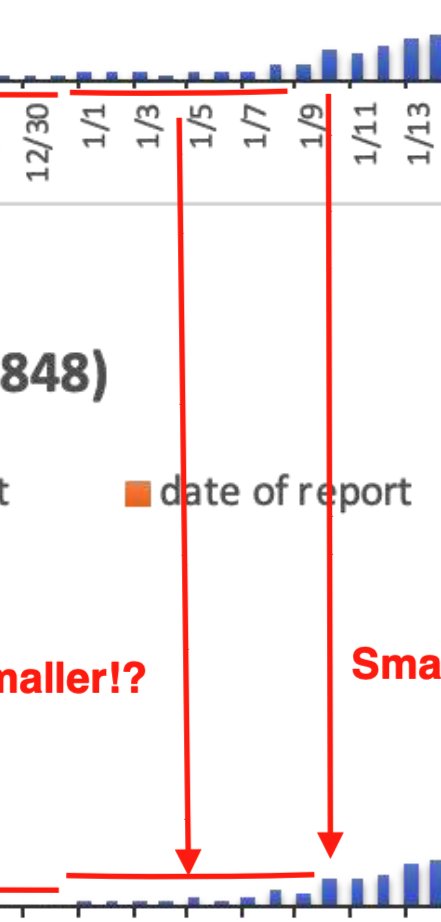
What's that big jump in confirmed cases on the 1st Jan (onset date)?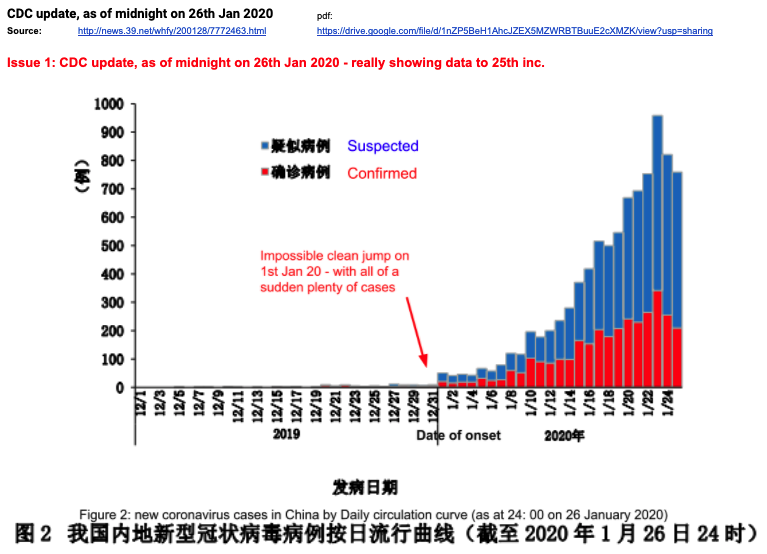
Because that means jumping from at most 4 or 5 cases in the last week of Dec 19 to suddenly 40 to 50 cases on Jan 1st and following days.
It's a change of scale of x10 - and these are confirmed cases per **onset** dates, not reporting date.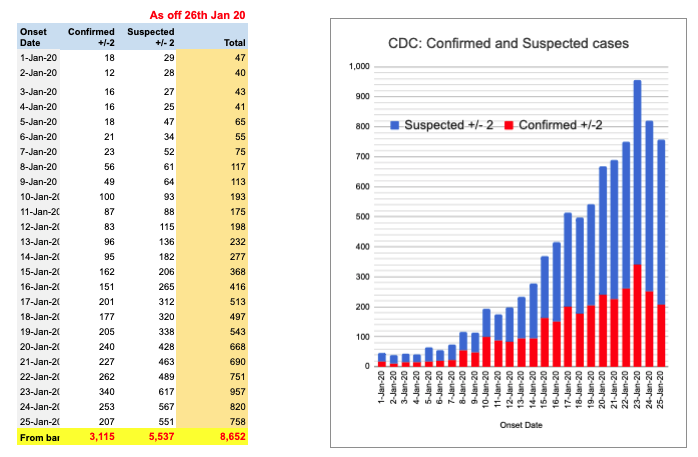
Which proves that Dec 19 confirmed cases were not being properly reported.
Better shave that away and make it look more natural, just like a late outbreak.
And please drop some Nov and early Dec cases for good measure.
@MarionKoopmans @Peterfoodsafety
It's normal for the bars to be higher from graph to graph. More cases drop in the onset date buckets as more are eventually reported.
But they cannot be lower - what has been reported cannot be taken away - unless they change the onset date of a case or 'disappear' it.@threadreaderapp compile
-
Silent Numbers: when the numbers don't add up
@Daoyu15 @Daoyu15, that is not even the beginning.
As Embarek said himself very well, with 174 Dec 19 known cases, you have typically at least 1,000 Dec 19 cases, which means necessarily Nov 19 cases and likely Oct 19 cases.
docs.google.com/document/d/1Zj…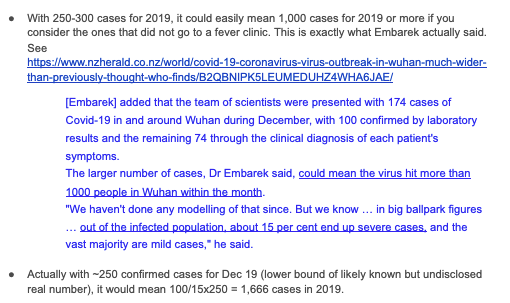
@Daoyu15 And then you have the Silent Numbers, the cabinet of curiosities of blatant manipulations and 'disappeared' Nov and Dec cases.
@Daoyu15 Check the thread above in detail.
One interesting one is the interview with the Health Times where Pr. Yu Chuanhua (in charge of the national database) called back to retract 2 Nov cases just after the gag order of the 25th Feb.
See:@Daoyu15 I am compiling a collection of these manipulations.
A good start is here (note that there are 6 tabs to that spreadsheet):
docs.google.com/spreadsheets/d…
@Daoyu15 Then there are interesting tidbits, such as
@Daoyu15 Also this letter to a virology journal showing 10% seropositivity through a sample of 1,021 people getting a test before returning to work in central Wuhan.
onlinelibrary.wiley.com/doi/epdf/10.10…@Daoyu15 This would be close to the Boston or Madrid numbers.
God only knows how Wuhan only ended up with 5,000 Covid-19 deaths in these conditions, especially since hospitals were totally overrun in Jan 20 and suspected infected people just had to stay at home.
nytimes.com/interactive/20…
-
Another proof of misreported Dec 19 cases
See this graph below. Many 'Unspecified ' and 'Other' pneumonia deaths in the first 6 weeks of 2020 in the Wuhan monitoring districts (DSPs).
The onset dates of many (if not the majority) of these would typically be in Dec 2019.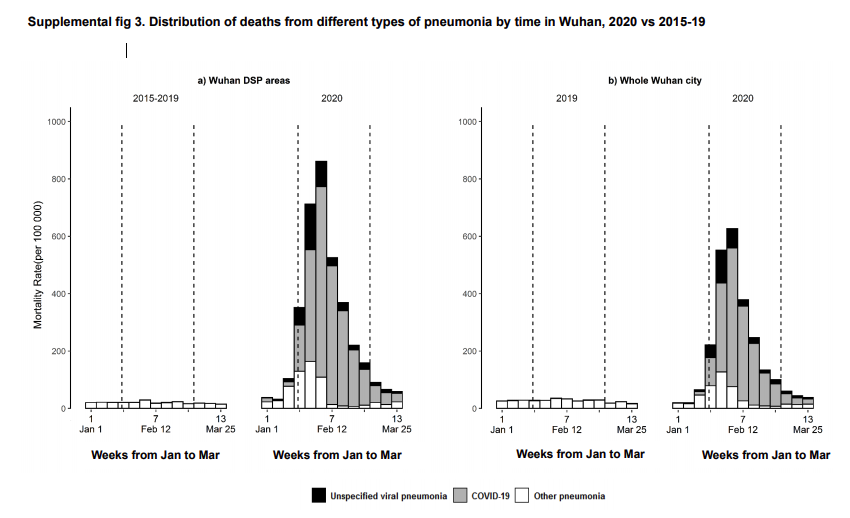
You can tie that back to the 'smoking gun' graph below published by the Chinese CDC on the 27th Jan 20.
Basically until Jan 1st, most cases were classified as Other or Unknown pneumonia.
One year later China is still telling us a long story and the WHO is looking the other way.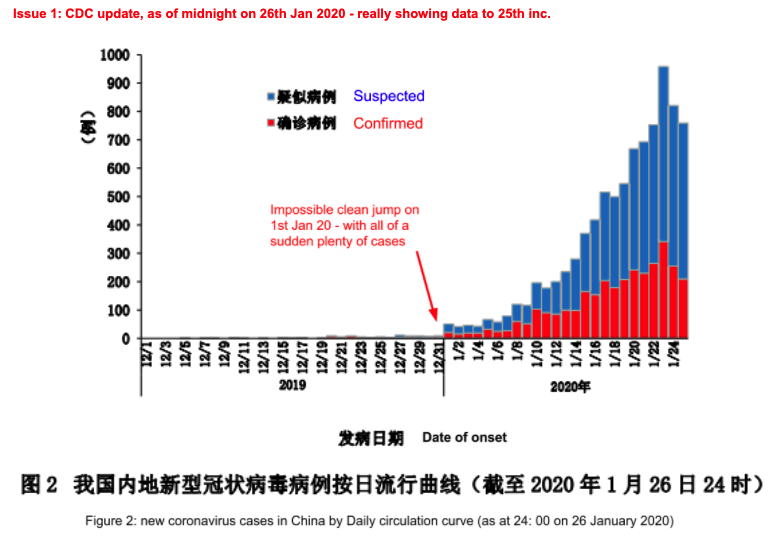
For the papers:
bmj.com/content/372/bm…
bmj.com/content/bmj/su… (a gold mine of info)
news.39.net/whfy/200128/77…One more important point.
The graph is about causes of deaths.
In the early days mortality was about 5% or so in Wuhan. So the actual number of misreported cases is likely around 20 times that.
From there one can deduce a good estimate of misreported numbers in Dec 19.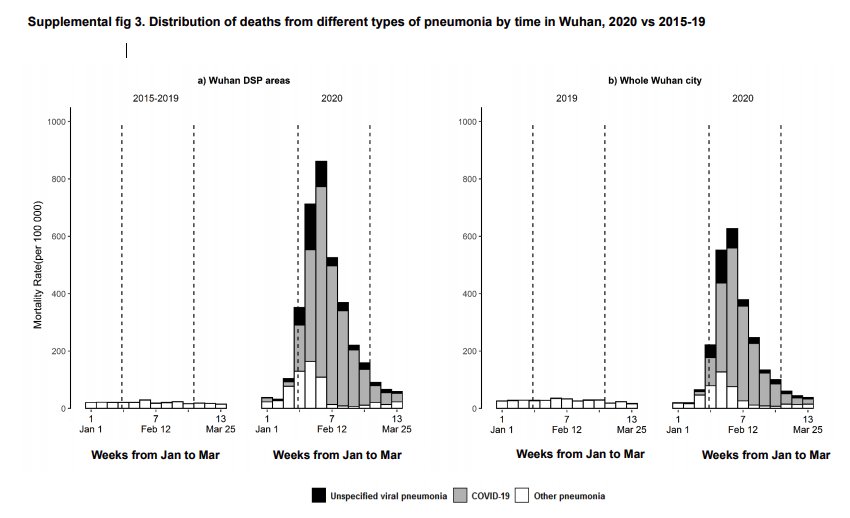
And we also have this essential paper about IgG seropositivity in Wuhan.
Around 4.4% seropositivity in urban Wuhan. The actual infection rate (inc. asymptomatic) is higher. Some key info is in the Supplements.
jamanetwork.com/journals/jaman…All this taken together, we start seeing how the urn counts is actually very realistic.
All these statistical paths point to it.
medrxiv.org/content/10.110… -
Manipulated official data about the 2019 Covid-19 cases
Sometimes you don't need to look very far to see how manipulated the official data about the 2019 Covid-19 cases is.
Case in point this graph from the Chinese CDC published on the 26th Jan 2020, showing confirmed and suspected cases by date of onset:
When I look at this it strikes me that the disease should instead be called 'Jan the 1st' pulmonary infection.
Again these are onset dates - not reported dates.
See original (it's archived if it gets scrubbed)
news.39.net/whfy/200128/77…For the data nerd like me, it's alway a temptation to zoom on the axes.
It's certainly worth it in this case as this reveals many suspected or confirmed December cases:
Another very important element is the (now scrubbed) interview in the Chinese Health Times conducted shortly before the CDC gag order of the 25th Feb 2020.
Just before publication on the 27th the interviewee called back to retract the two Nov 19 cases!!
docs.google.com/document/d/e/2…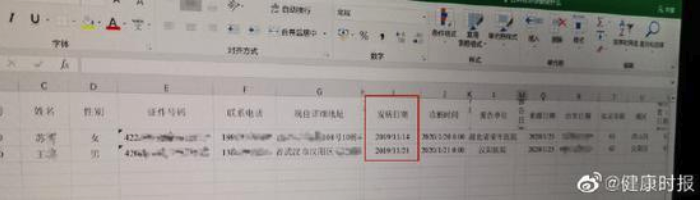
Anyway I put my notes there:
docs.google.com/document/d/1Zj…These notes link back to my 'cabinet of curiosities' spreadsheet.
Well, a bit more than curiosities, more like very creative reporting by the Chinese authorities.
docs.google.com/spreadsheets/d…@threadreaderapp compile
-
Silent Numbers: the WHO art of ignoring the obvious
Have you ever wondered why the Lancet study graph had no cases on the last 4 days of December 2019?
That study used the official figures released by China on the 3rd Jan 2020 after an express request from the WHO on the 1st Jan.
thelancet.com/journals/lance…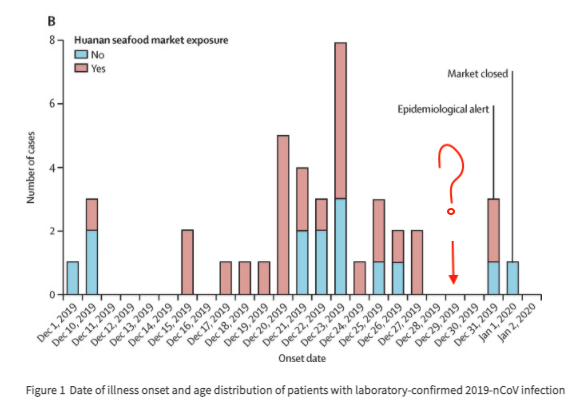
Have you ever wondered why the CDC report on the 26th January has a big jump on the 1st Jan 2020?
Weird - suddenly plenty of cases starting spot on the 1st Jan.
doc88.com/p-133733419147…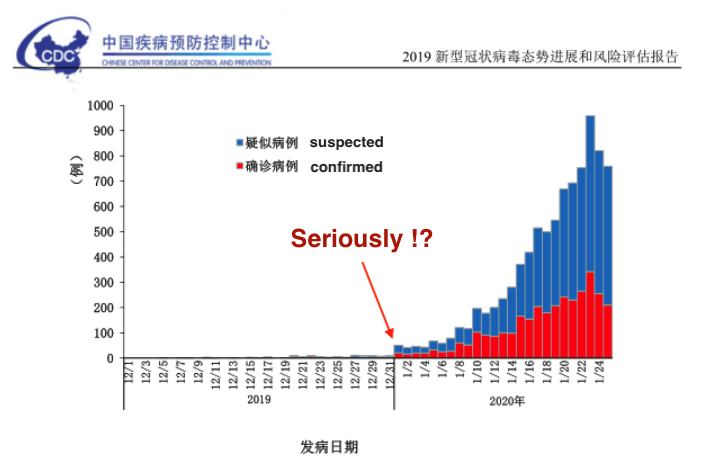
Have you ever wondered why when you magnify the Dec part of that graph, you see cases on the 5th , 7th, 8th of December (confirmed or suspected)?
And plenty of cases from the 27th to the 31st.
That graph was published 2 days after the Lancet paper.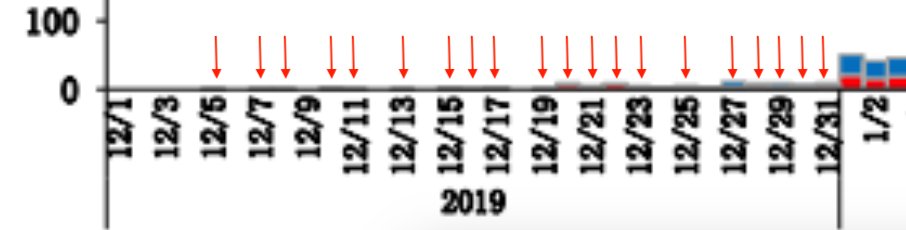
That jump on the 1st Jan is then confirmed by a CDC paper published on the 17th Feb
And if you look carefully, you will notice that there is an odd fat tail from the 1st to the 3rd Jan, on top of the jump on the 1st Jan.
weekly.chinacdc.cn/en/article/doi…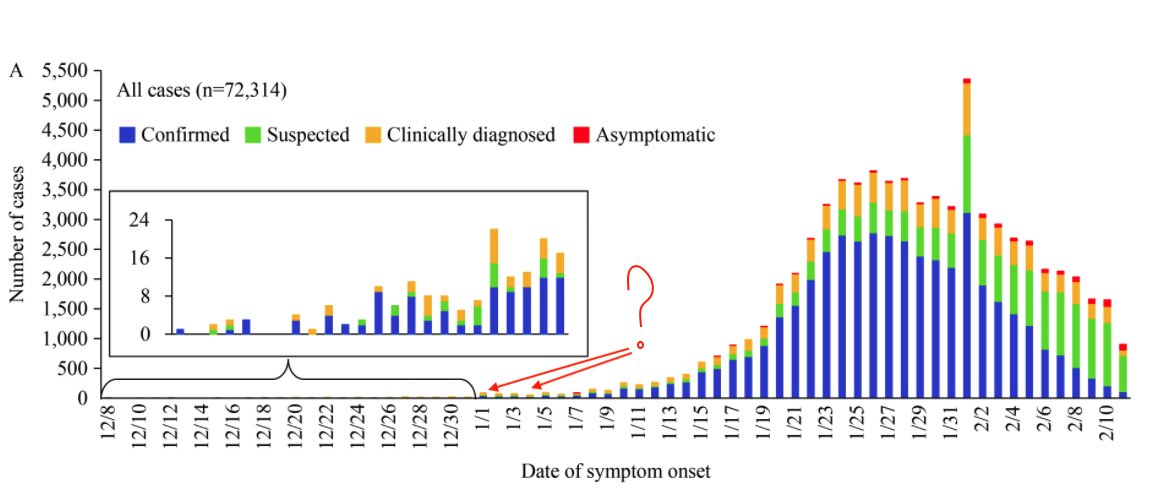
At least that paper gave a precise count of confirmed cases for Dec 19: 104 (confirmed, not suspected).
It's in Table 1: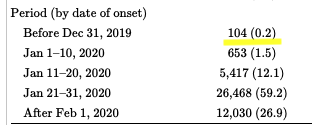
But then when you revert the graph you end up with 102 cases, not 104:
Basically the graph was artificially cut at the 8th Dec when there were two more cases before.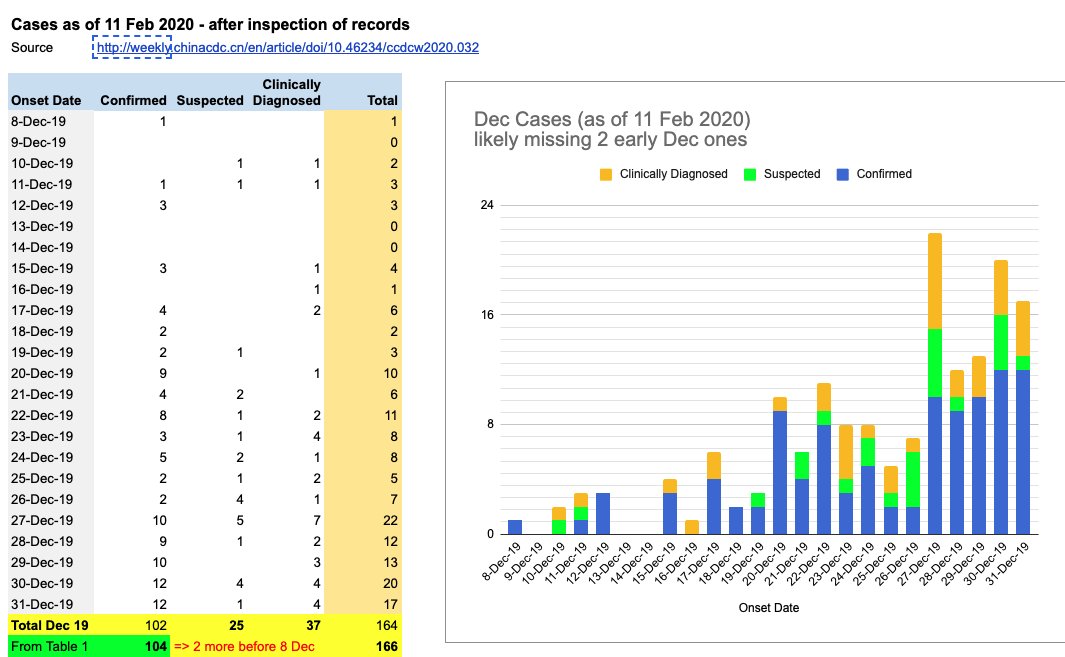
Which must be very useful because it ties up with what China told the WHO earlier in January:
"Symptom onset of the 41 confirmed nCoV cases ranges from 8 December 2019 to 2 January 2020. "
who.int/csr/don/12-jan…It also tied up with Li et al paper of the 29 Jan 20 which has the first case on the 8 Dec and a total of 47 confirmed cases for Dec 19.
Anyway the last we semi-officially know is that there were at least 124 confirmed cases with Dec 19 onset (ToRS backdoor disclosure in Nov 20).
Not far from the 104 of the CDC report of the 17 Feb 2020 with its fancy artificial jump and fat leg on the 1st Jan 2020.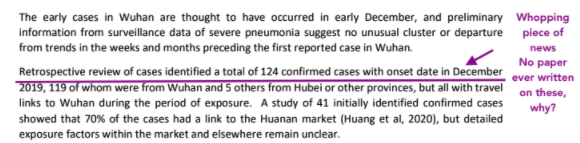
But we also have the SCMP leak of the 13 Mar 2020, for confirmed cases also (not suspected).
sg.news.yahoo.com/coronavirus-ch…A leak of government data that gives 6 Nov 19 cases, and 266 confirmed Dec cases.
And STILL a big artificial jump on the 1st Jan 2020...
Which would mean at least 300 confirmed cases for Dec 19.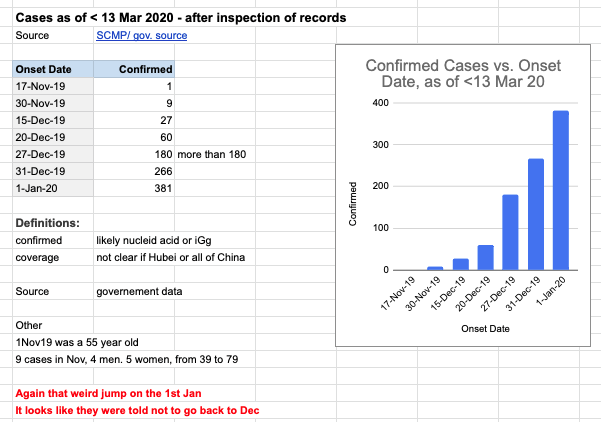
It looks like a lot.
But actually it's not that far from the CNN leak of the 1st Dec 20 based on official data (proper forensic checks) that must date from before Apr 20.
That data gave about 200 Dec 19 cases.
edition.cnn.com/2020/11/30/asi…So. all well considered, especially given that artificial 'wall' on the 1st Jan where all of a sudden the numbers jump up:
250 to 300 confirmed cases with onset in 2019 is a very likely scenario.
The backdoor-official 124 are likely not half of the true count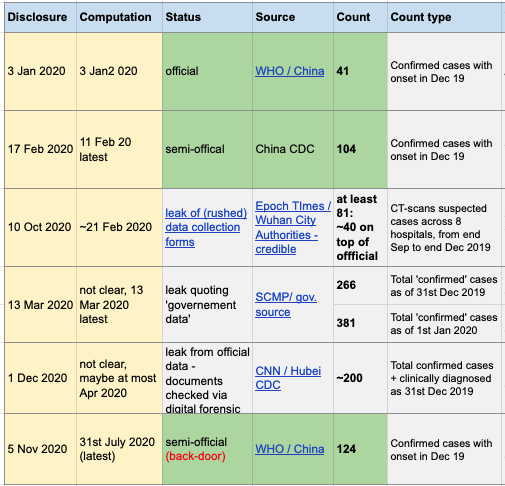
@threadreaderapp compile
-
'Let's make sure to look the other way': the fantasy story of the 2019 cases
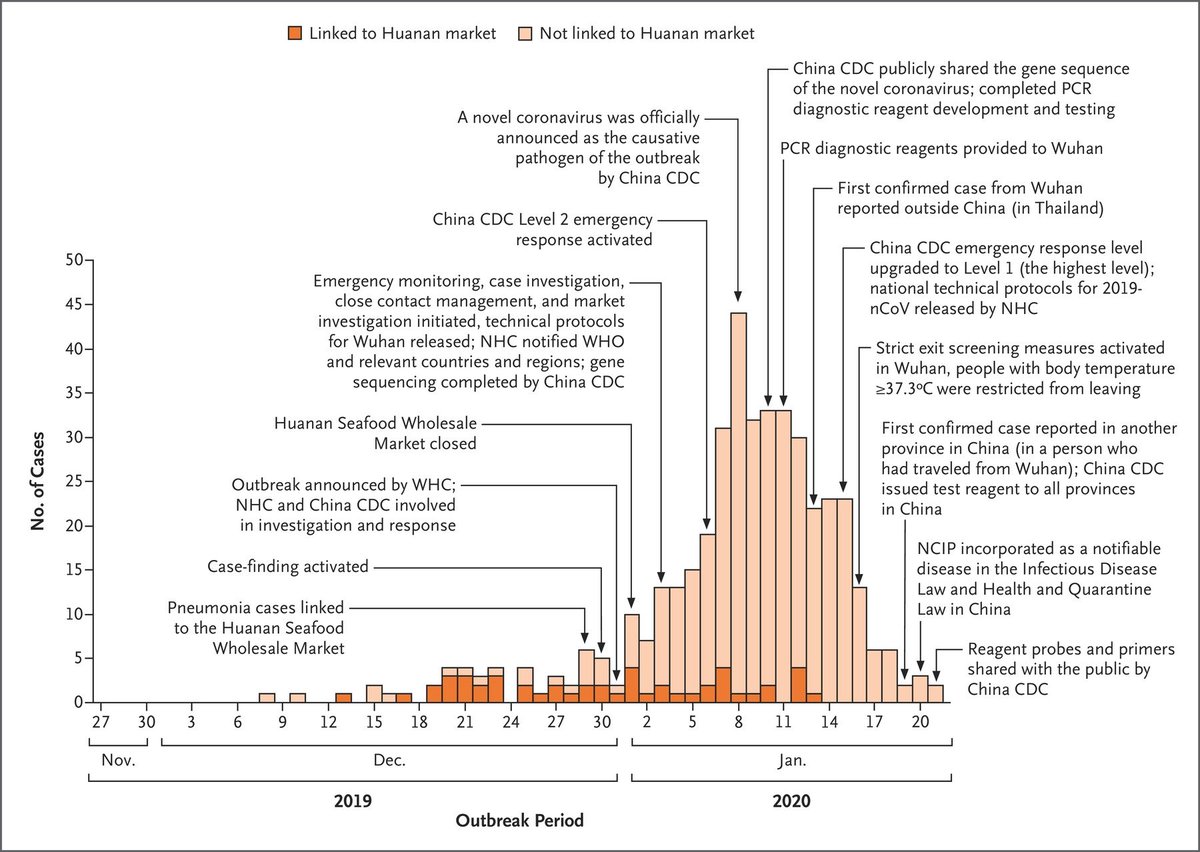
1/ It was easy to miss Dr Lucey's excellent questions about the mounting number of confirmed Covid-19 cases in Dec 19 - acknowledged all indirectly and through the back-door, never in a direct manner:
sciencespeaksblog.org/2020/11/28/fiv…2/ Recap: On the 5th Nov the Terms of Reference (ToRs) of the WHO mission were quietly published on the WHO website. These terms were negotiated with China and finalised on 31st July.
These ToRs contain a crucial new piece of information:3/ "Retrospective review of cases identified a total of 124 confirmed cases with onset date in December 2019, 119 of whom were from Wuhan and 5 others from Hubei or other provinces, but all with travel links to Wuhan during the period of exposure."
drive.google.com/file/d/1rx0W2e…4/ This is the ** first and only ** official recognition of new Dec cases beyond the 41 disclosed on the 2nd Jan 2020 at the express request of the WHO (whereby WHO member countries have 48 hours to answer). These were the 41 mentioned in the Lancet paper.
5/ This raises important questions:
a. Why were these 124 confirmed Dec 19 cases never mentioned before?
b. Was the 'Retrospective review of cases' the Rushed Data Collection discussed in the below article?
gillesdemaneuf.medium.com/early-cases-of…6/ c. Why was this crucial information withheld from at least the 31st July (finalisation of the ToRs) to the 5th Nov 2020 (publication of the ToRs)?
7/ d. Why is the scientific community not given access to these cases and to any corresponding SARS-CoV-2 sequences — ** absolutely basic steps to do research into the virus phylogeny and its likely origins ** ?
8/ e. Given that there are so many confirmed cases with Dec onset, there must clearly be Nov cases too. Why did the ‘retrospective review’ mentioned not return any? Was it artificially limited to December?
9/ The question above are very important:
The role of the WHO is to help find out the origins of SARS-CoV-2. By withholding information the WHO seems unfortunately to be doing just the opposite.
So when can scientists get the detail of these cases and the sequenced viruses?@threadreaderapp compile
subscribe via RSS