Shaping - Oddities in the confirmed cases graphs of the Feb 20 WHO report.
Am I the only one having problems making sense of the confirmed cases graphs in the WHO report of the 24th Feb 2020?
Page 7 is very troubling.
First there is an error of 2 days in the reporting dates of the 3 graphs (7/14/22 of Feb instead of 5/12/20).
drive.google.com/file/d/1cLW3dE… 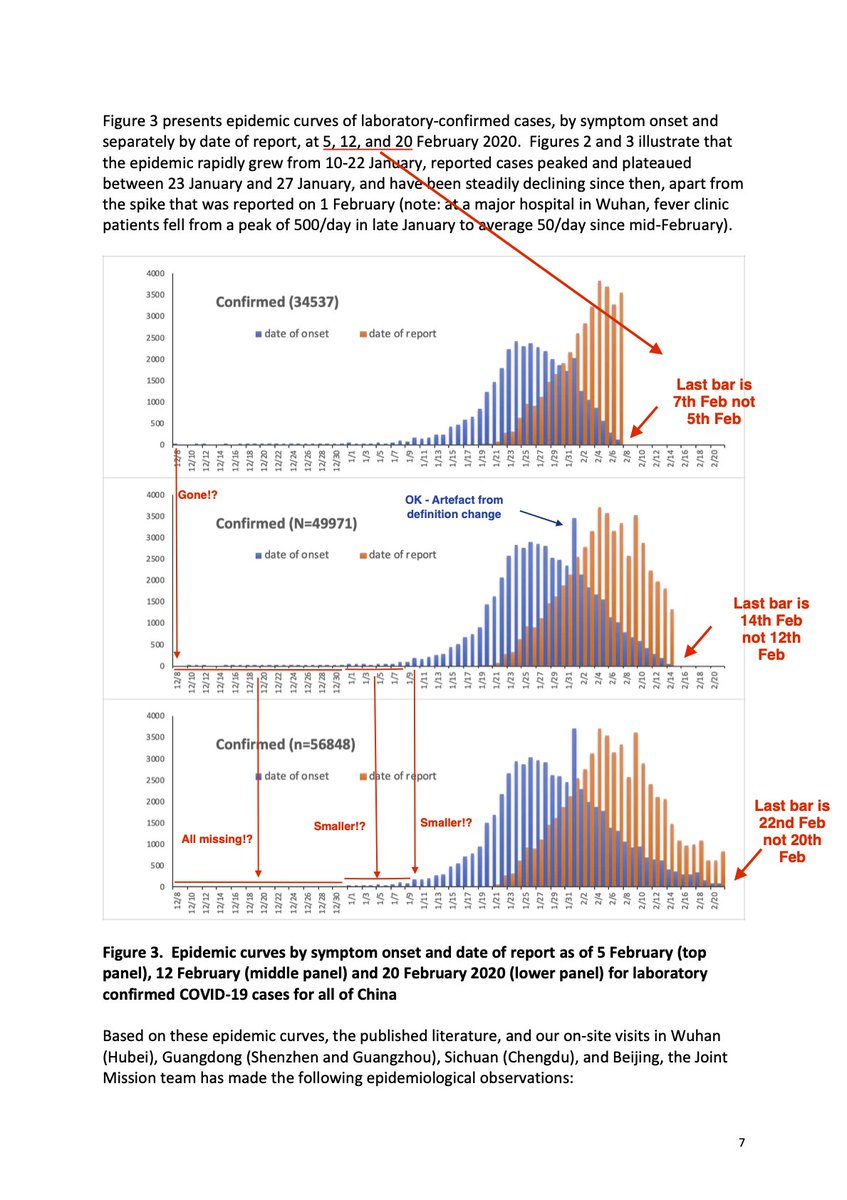
Then the first case (8th Dec) in the 1st graph (reporting as of the 5/7? Feb) is missing in the 2nd Graph [12/14? Feb].
And all the Dec 19 cases are missing in the 3rd graph [20/22? Feb], and there is some shaving of the number of early Jan cases!
@MarionKoopmans 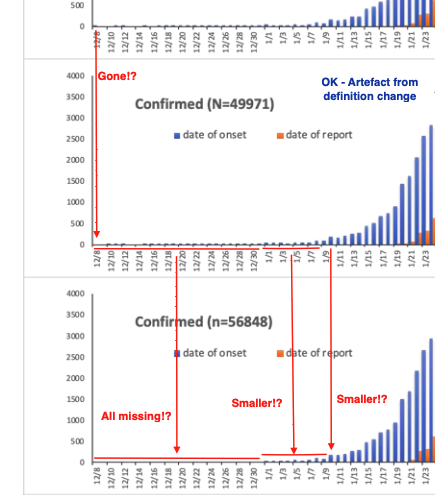
Now as these are all laboratory confirmed cases it's really odd. Once it has been reported a case should still be reported in the next graph (next reporting date).
Unless they play around with the onset dates and move the cases around, or simply 'disappear' them.
But what particularly strikes me is that the early Jan 2020 cases seem to be actively reshaped in the last graph to make it look more a late breakout, especially by shaving the first few days of Jan and even the 10th Jan: 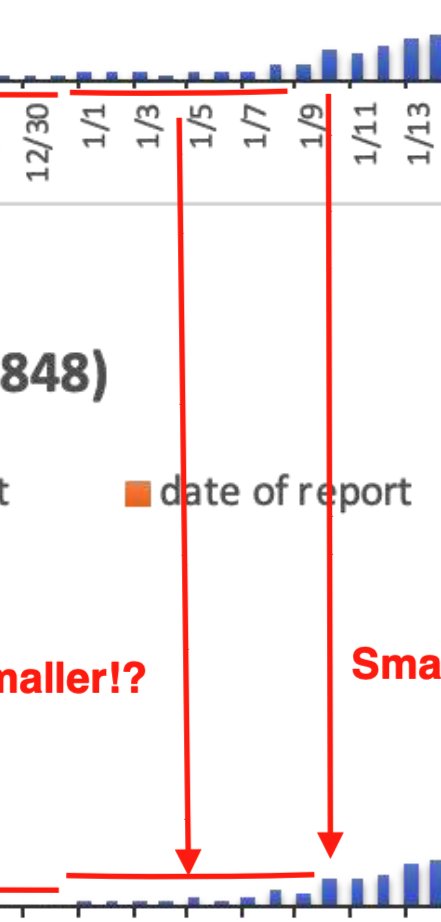
I guess that the original graph such as given here does not look too good.
What's that big jump in confirmed cases on the 1st Jan (onset date)? 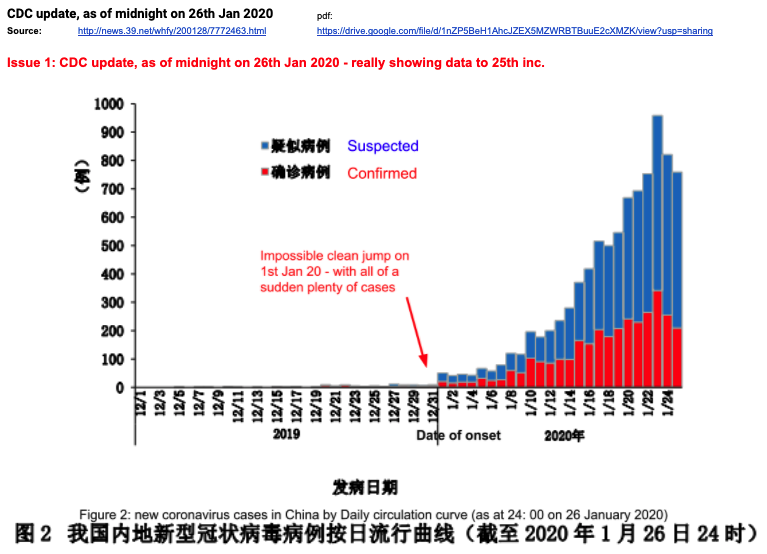
Because that means jumping from at most 4 or 5 cases in the last week of Dec 19 to suddenly 40 to 50 cases on Jan 1st and following days.
It's a change of scale of x10 - and these are confirmed cases per **onset** dates, not reporting date. 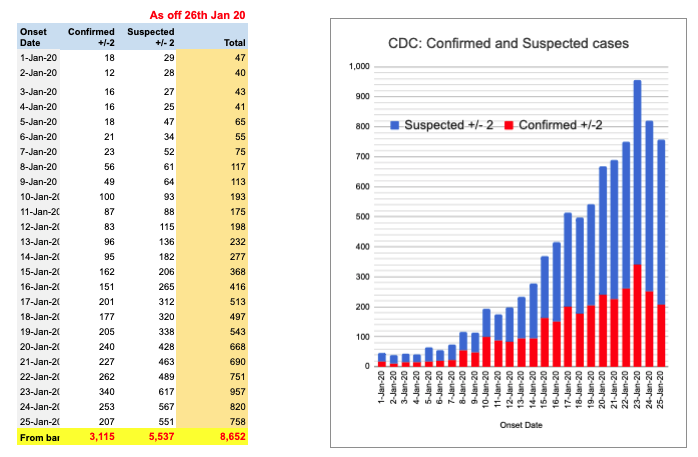
Which proves that Dec 19 confirmed cases were not being properly reported.
Better shave that away and make it look more natural, just like a late outbreak.
And please drop some Nov and early Dec cases for good measure.
@MarionKoopmans @Peterfoodsafety
It's normal for the bars to be higher from graph to graph. More cases drop in the onset date buckets as more are eventually reported.
But they cannot be lower - what has been reported cannot be taken away - unless they change the onset date of a case or 'disappear' it.
@threadreaderapp compile