Another proof of misreported Dec 19 cases
See this graph below. Many 'Unspecified ' and 'Other' pneumonia deaths in the first 6 weeks of 2020 in the Wuhan monitoring districts (DSPs).
The onset dates of many (if not the majority) of these would typically be in Dec 2019. 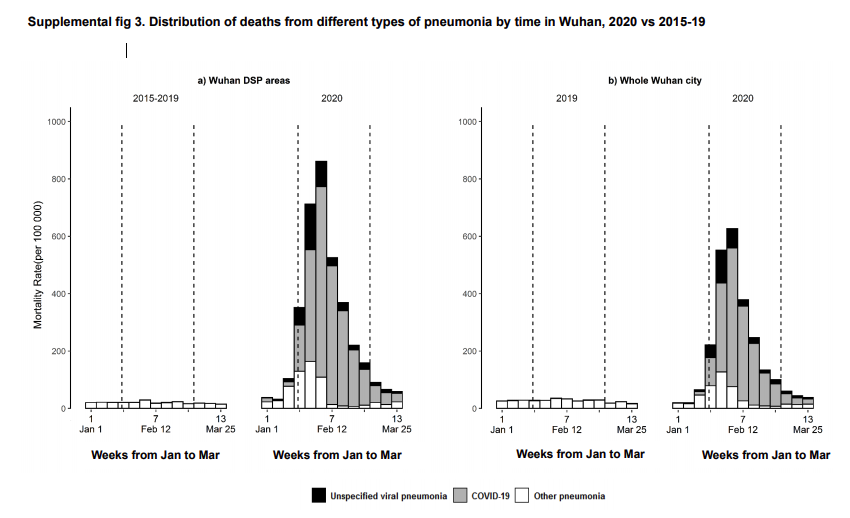
You can tie that back to the 'smoking gun' graph below published by the Chinese CDC on the 27th Jan 20.
Basically until Jan 1st, most cases were classified as Other or Unknown pneumonia.
One year later China is still telling us a long story and the WHO is looking the other way. 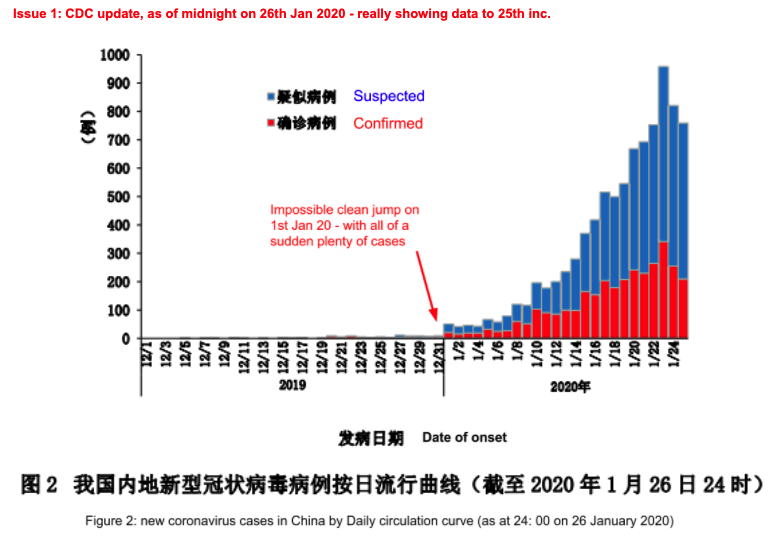
For the papers:
bmj.com/content/372/bm…
bmj.com/content/bmj/su… (a gold mine of info)
news.39.net/whfy/200128/77…
One more important point.
The graph is about causes of deaths.
In the early days mortality was about 5% or so in Wuhan. So the actual number of misreported cases is likely around 20 times that.
From there one can deduce a good estimate of misreported numbers in Dec 19. 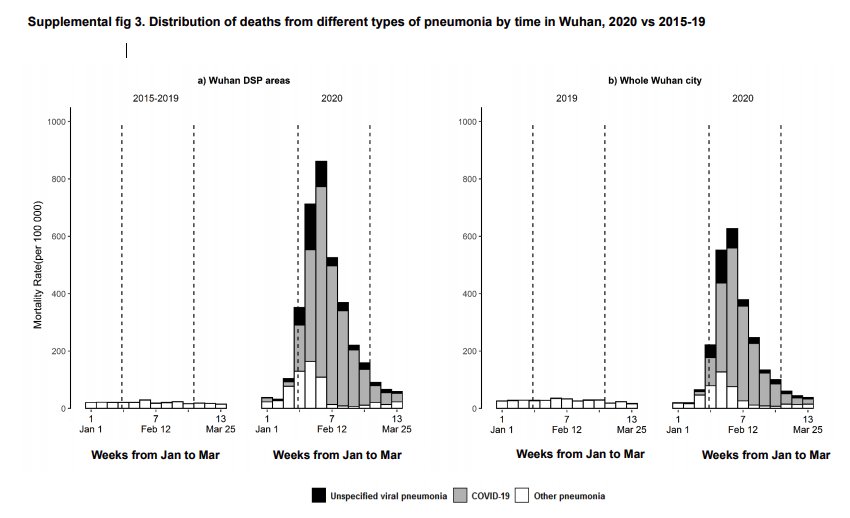
And we also have this essential paper about IgG seropositivity in Wuhan.
Around 4.4% seropositivity in urban Wuhan. The actual infection rate (inc. asymptomatic) is higher. Some key info is in the Supplements.
jamanetwork.com/journals/jaman…
All this taken together, we start seeing how the urn counts is actually very realistic.
All these statistical paths point to it.
medrxiv.org/content/10.110…